After the Tax Cuts and Jobs Act was passed on December 22, 2017, there was much speculation of what the effects would be. One claim was that with the cash savings from the tax cut, and with the cash that had been locked abroad, corporations would engage in massive stock repurchases. And, not many months after tax reform passed, and for the year after, there were many, many news articles ensuring us that tax reform resulted in massive share repurchases. See here, here, here, here, here, here, here, here, here, here, here, here, for a few examples. Feelings were so heated regarding share repurchases, that even Republican Senator Marco Rubio devised a plan to stop companies from returning cash to their shareholders. But what actually happened?
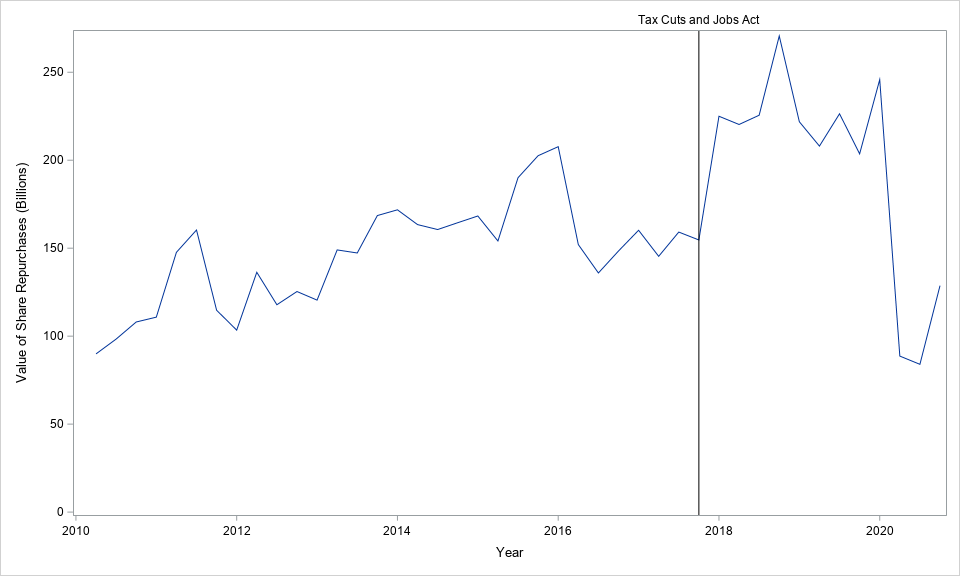
I had a paper published (jointly with Michelle Hanlon and Joel Slemrod) shortly after the TCJA passed that found no surge in repurchases, but, perhaps not enough time had passed to allow firms time to repurchase their shares. Now, several years have passed. So, I decided to dust off the computer program that I used in that paper, and look at the data once again. I used the data from the public firms in Compustat, and, simply graphed the dollar value of their quarterly share repurchases, from 2010 to the end of 2020 (as far as data are available). There is, not surprisingly, a big dip because of COVID at the end:
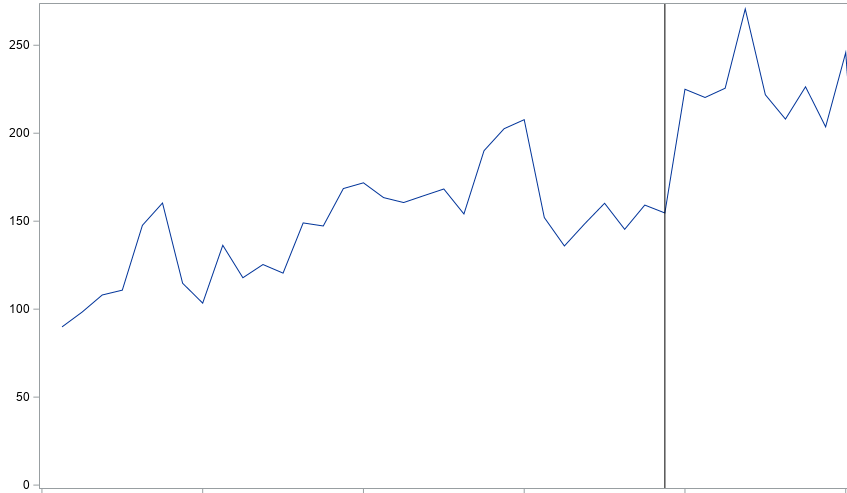
Instead of running regressions, I decided to use a crowd-sourced ocular test. That is, I emailed a handful of my accounting professor colleagues, showed them the graph of repurchases with the line where the TCJA happened, and ask them to tell me what they saw. They did not know what the axes were. Here is what I sent:
Here is what they said when asked to provide a single sentence about what they saw. I include all the responses I got (I emailed 11 people, and got 8 responses within the 2 hours I waited):
What to take away from this, aside that some of my accounting professor colleagues can’t count to one sentence (I kid…)? Personally, I would say you see an upward trend, there was a depression (which lasts from about when Donald Trump was elected to the passage of the TCJA), and, then the trend moves back up to baseline.
But, my view of the graph is certainly tainted by my knowing what the graph was, and imposing my own based views into its interpretation. Some of my colleagues simply saw an increasing trend, others an effect at the line, some no trend at all because of the variation.
The ocular test is not the only test that is tainted by these biases. I can run a regression and fit a line to these data that either does, or does not, show the TCJA having a positive effect on the volume of repurchases, depending on the specification. And, of course, what you think is a “reasonable” specification may well be informed by your biases.
So, did repurchases increase because of the TCJA? Like many things, it depends on who you ask.